
Technicals for the intelligent investor
Optimize your
investment strategy.
A tool for helping you know when to add, when to wait, and when to trim.
Standard from $20/month · 7-day free trial for new accounts
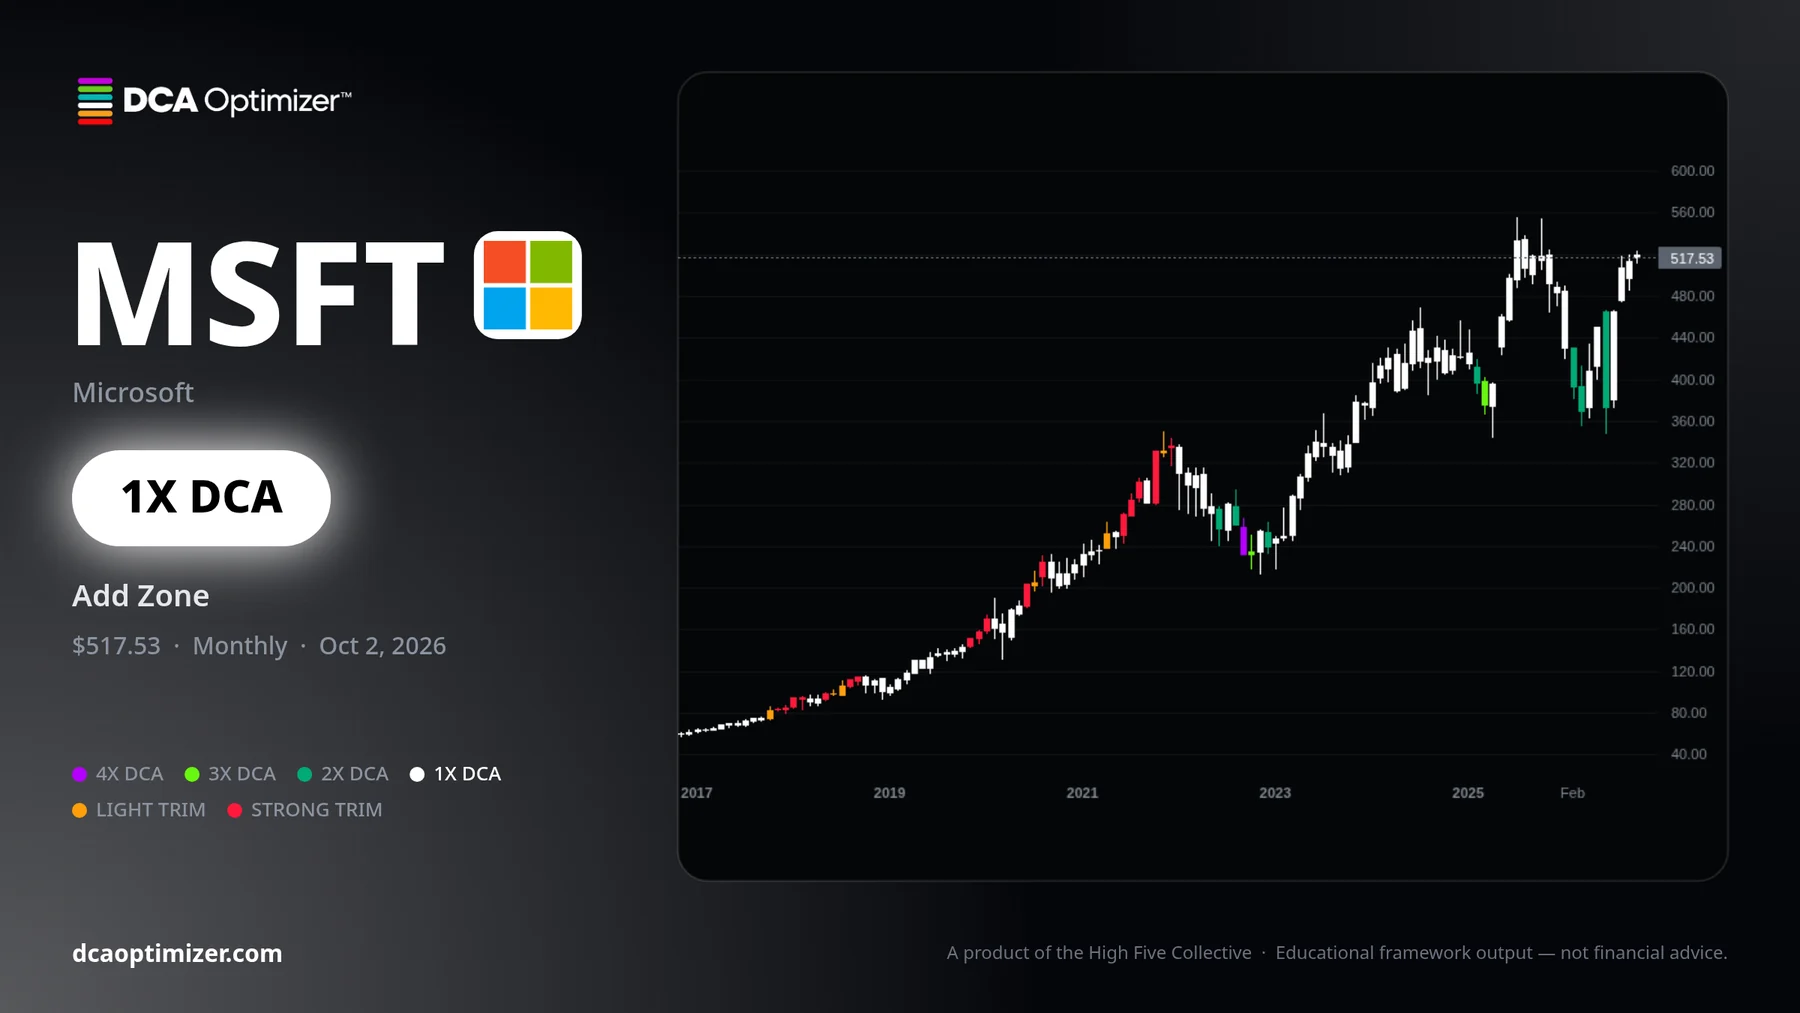
Frozen chart examples captured Oct 3, 2026 · Not live signals or recommendations
Inside the web app
From the whole market to a single stock.
Real screens from the app. No TradingView needed.
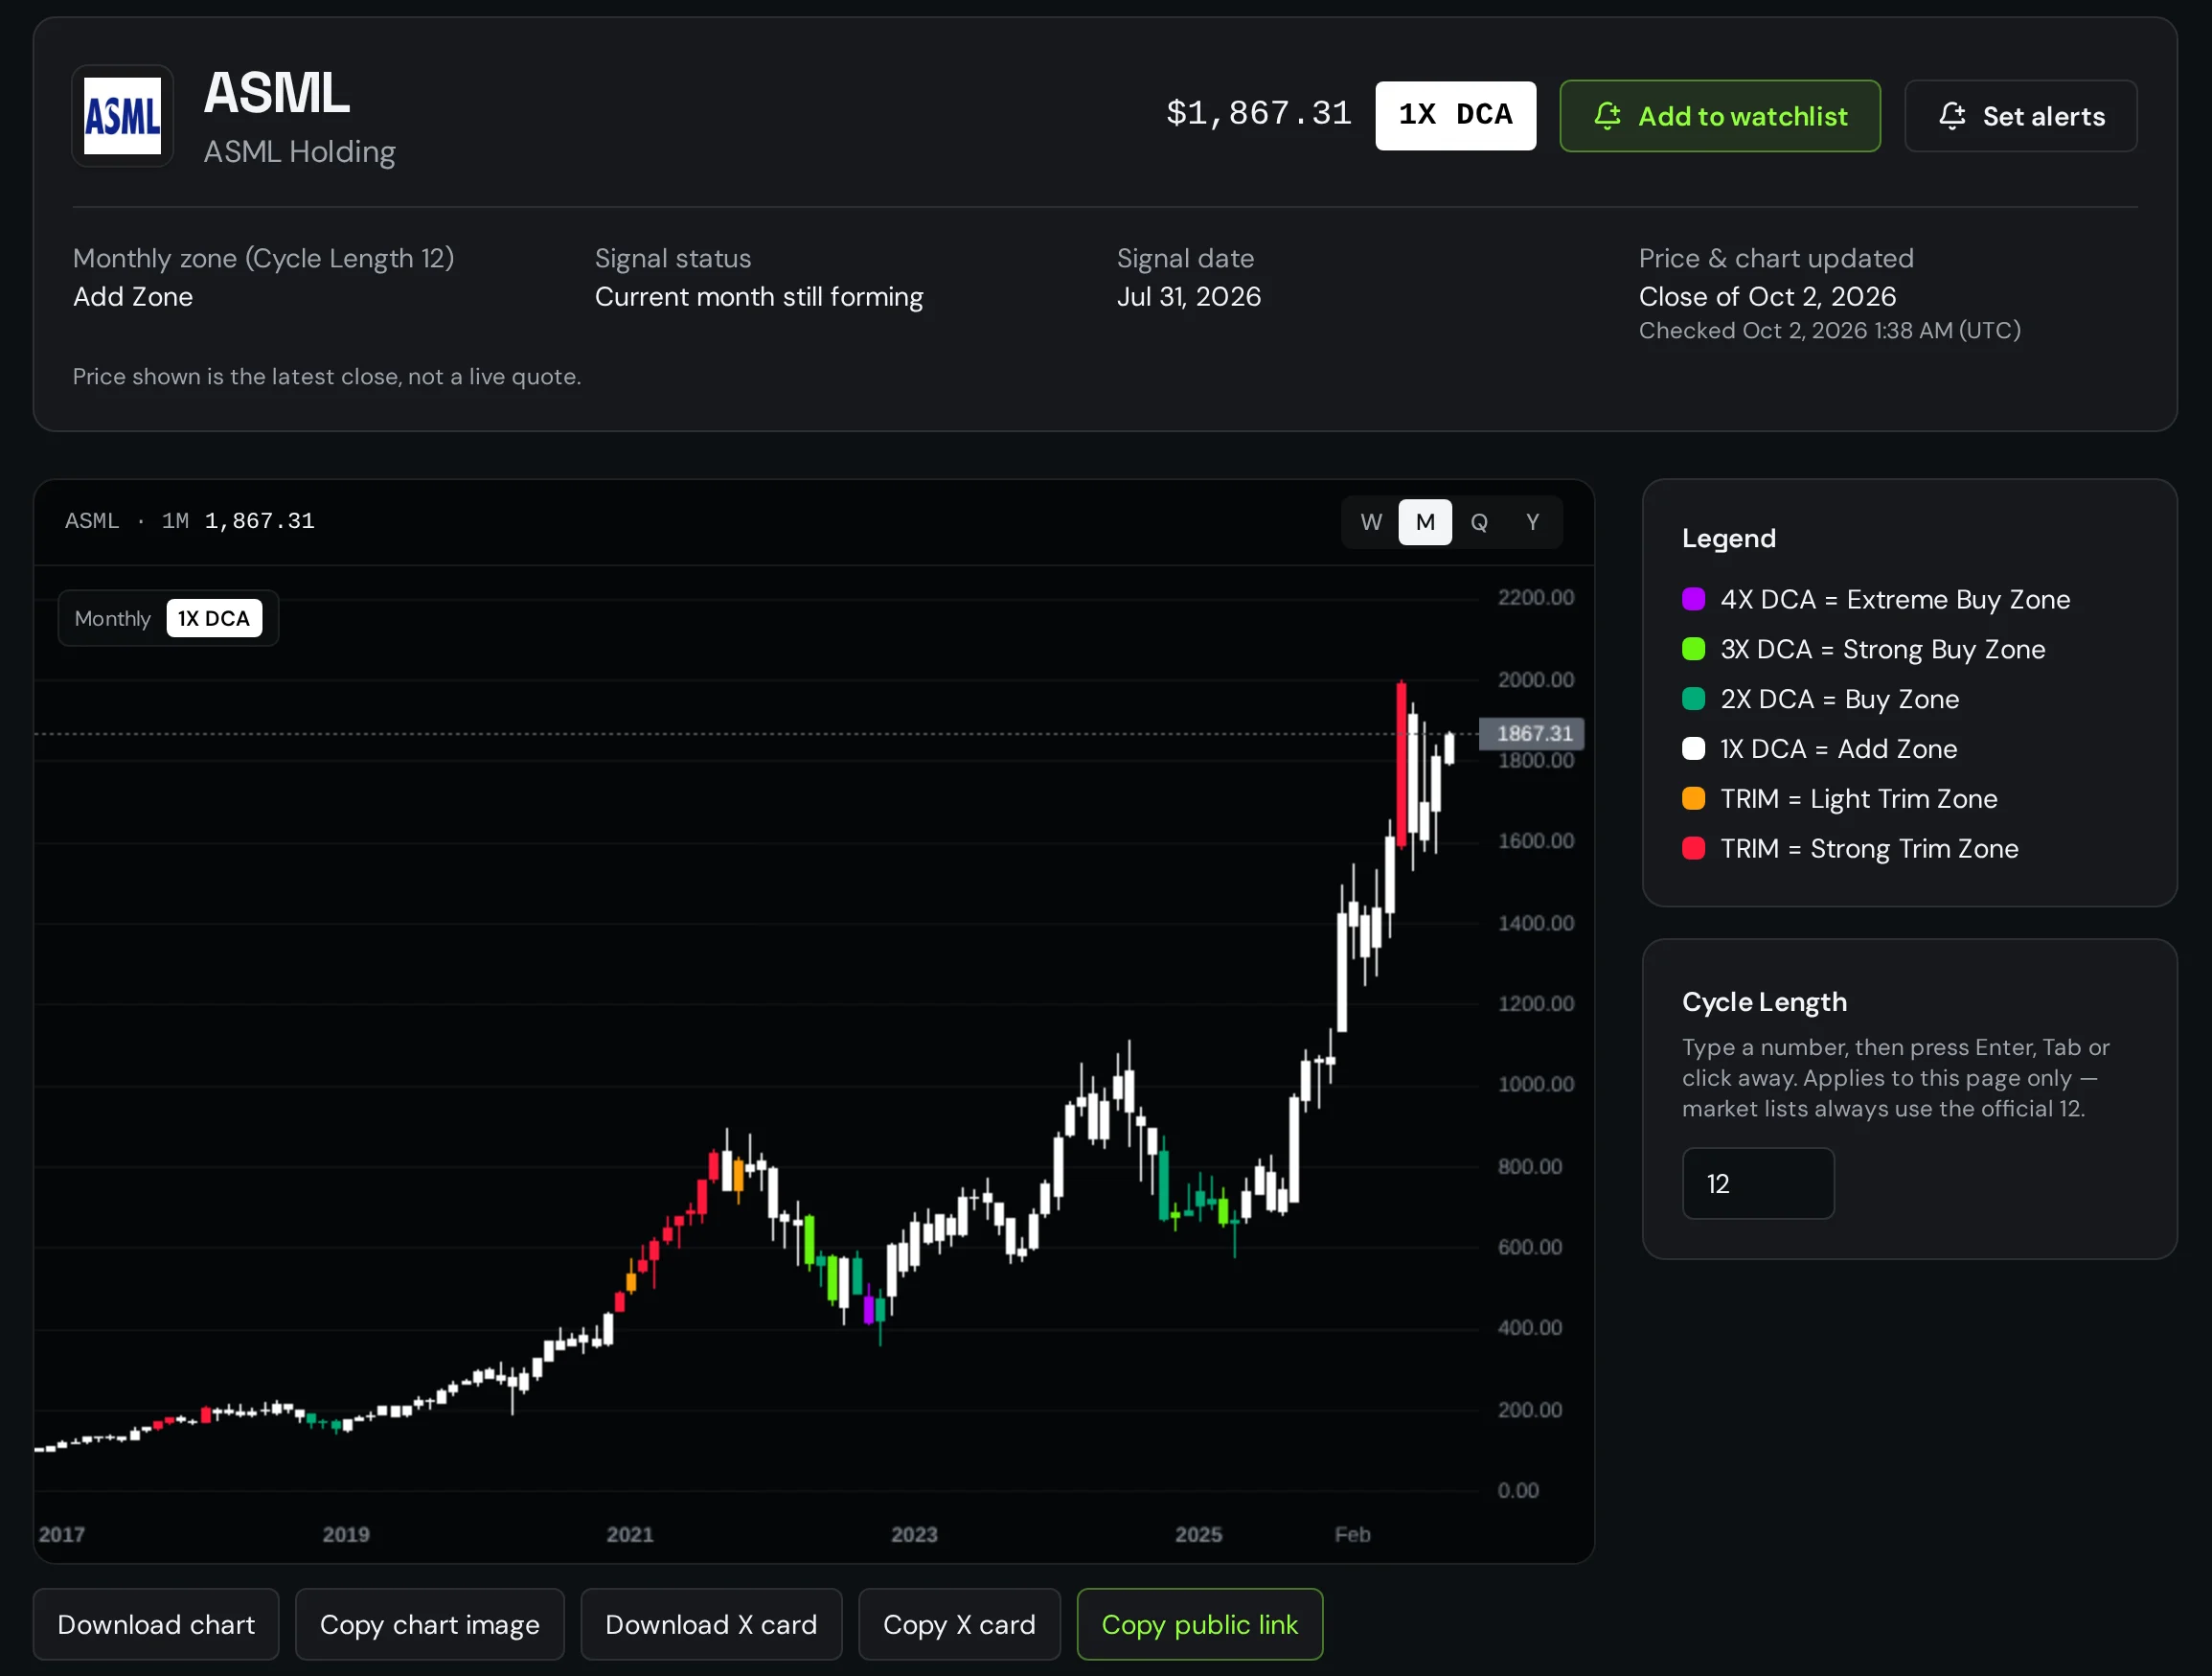
01 / Stock pages
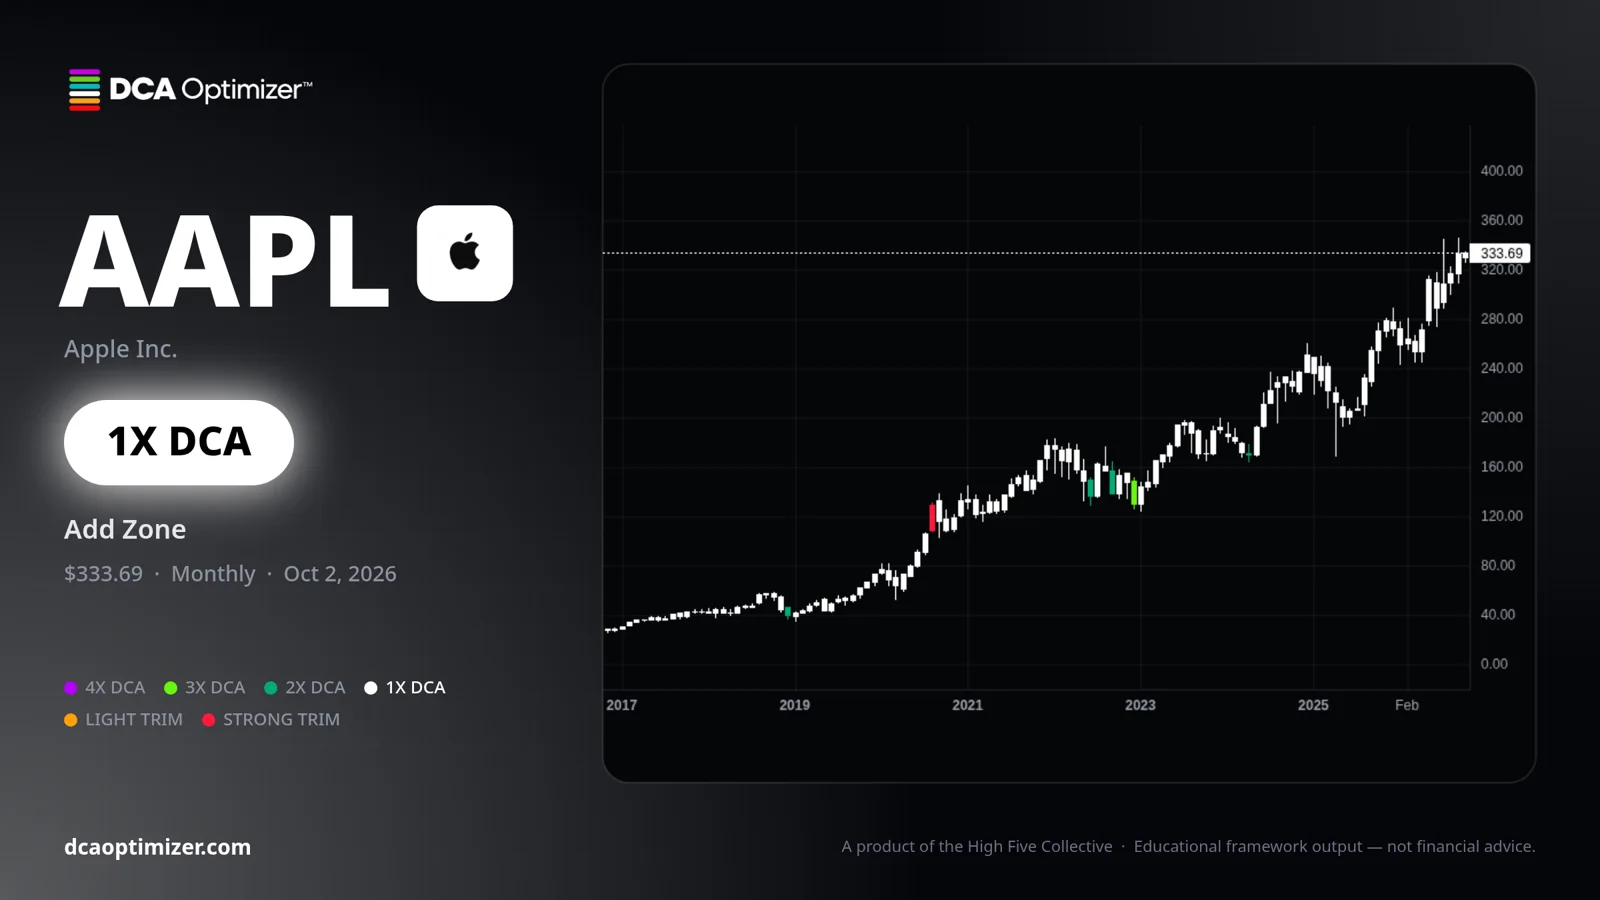
Every stock has a verdict.
Monthly chart colored by zone, the current verdict, intramonth touches and past signals.
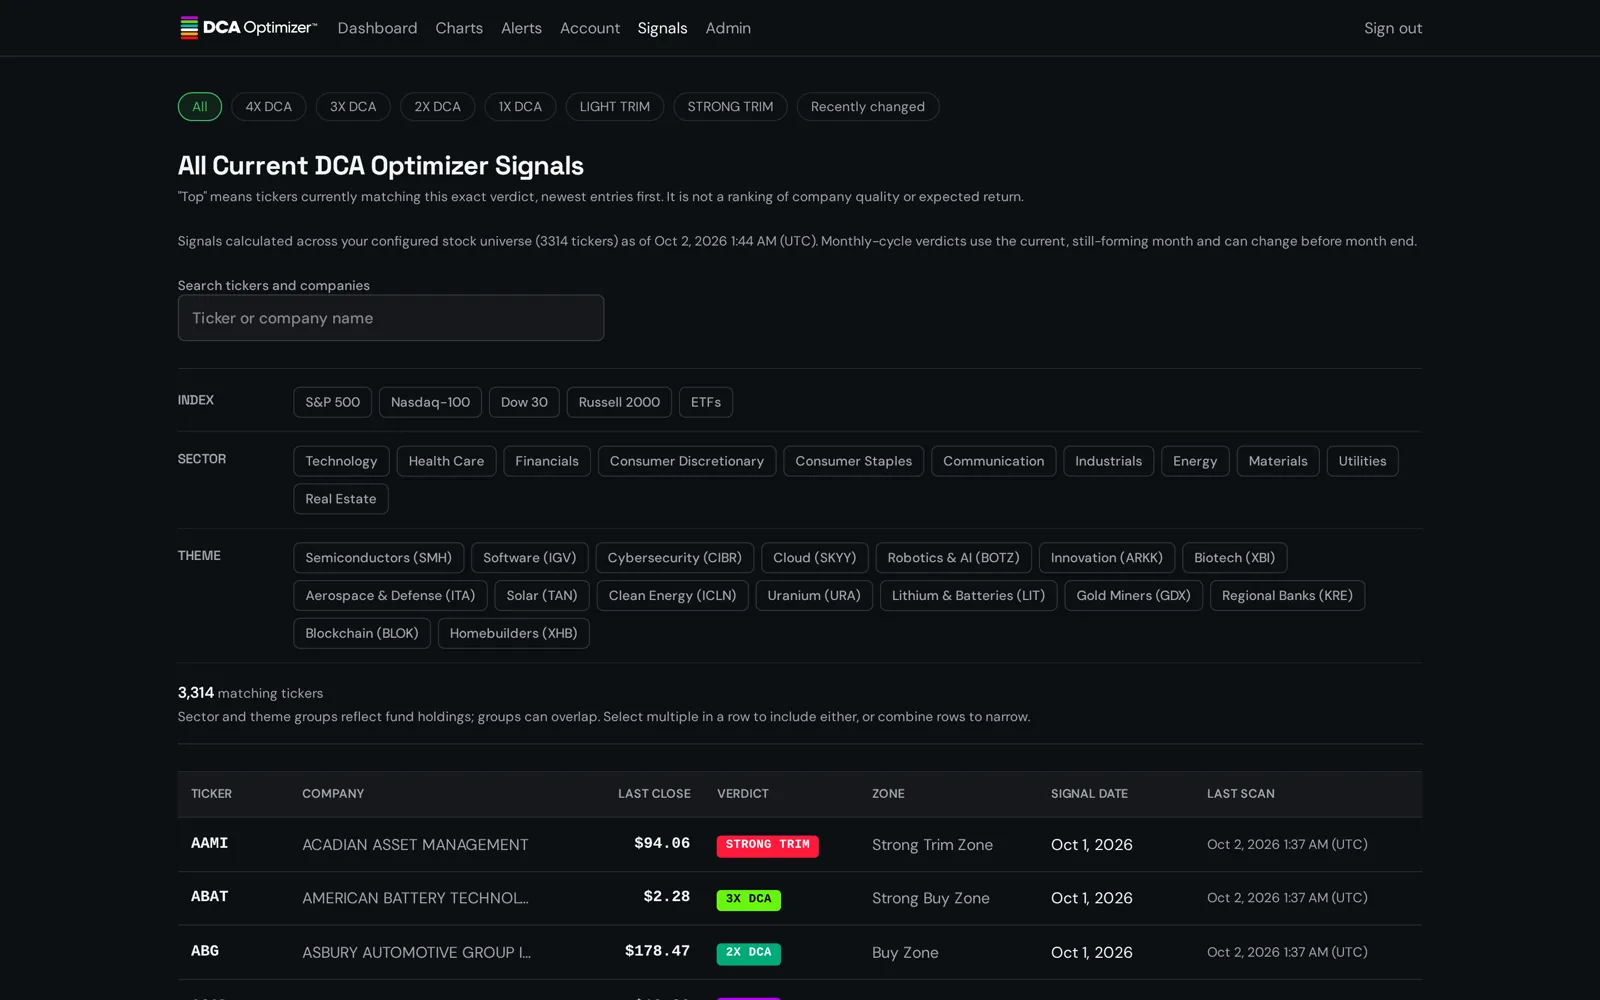
02 / Screener
The market, filtered.
Every scanned ticker by verdict, index, sector and theme. Sort any column.
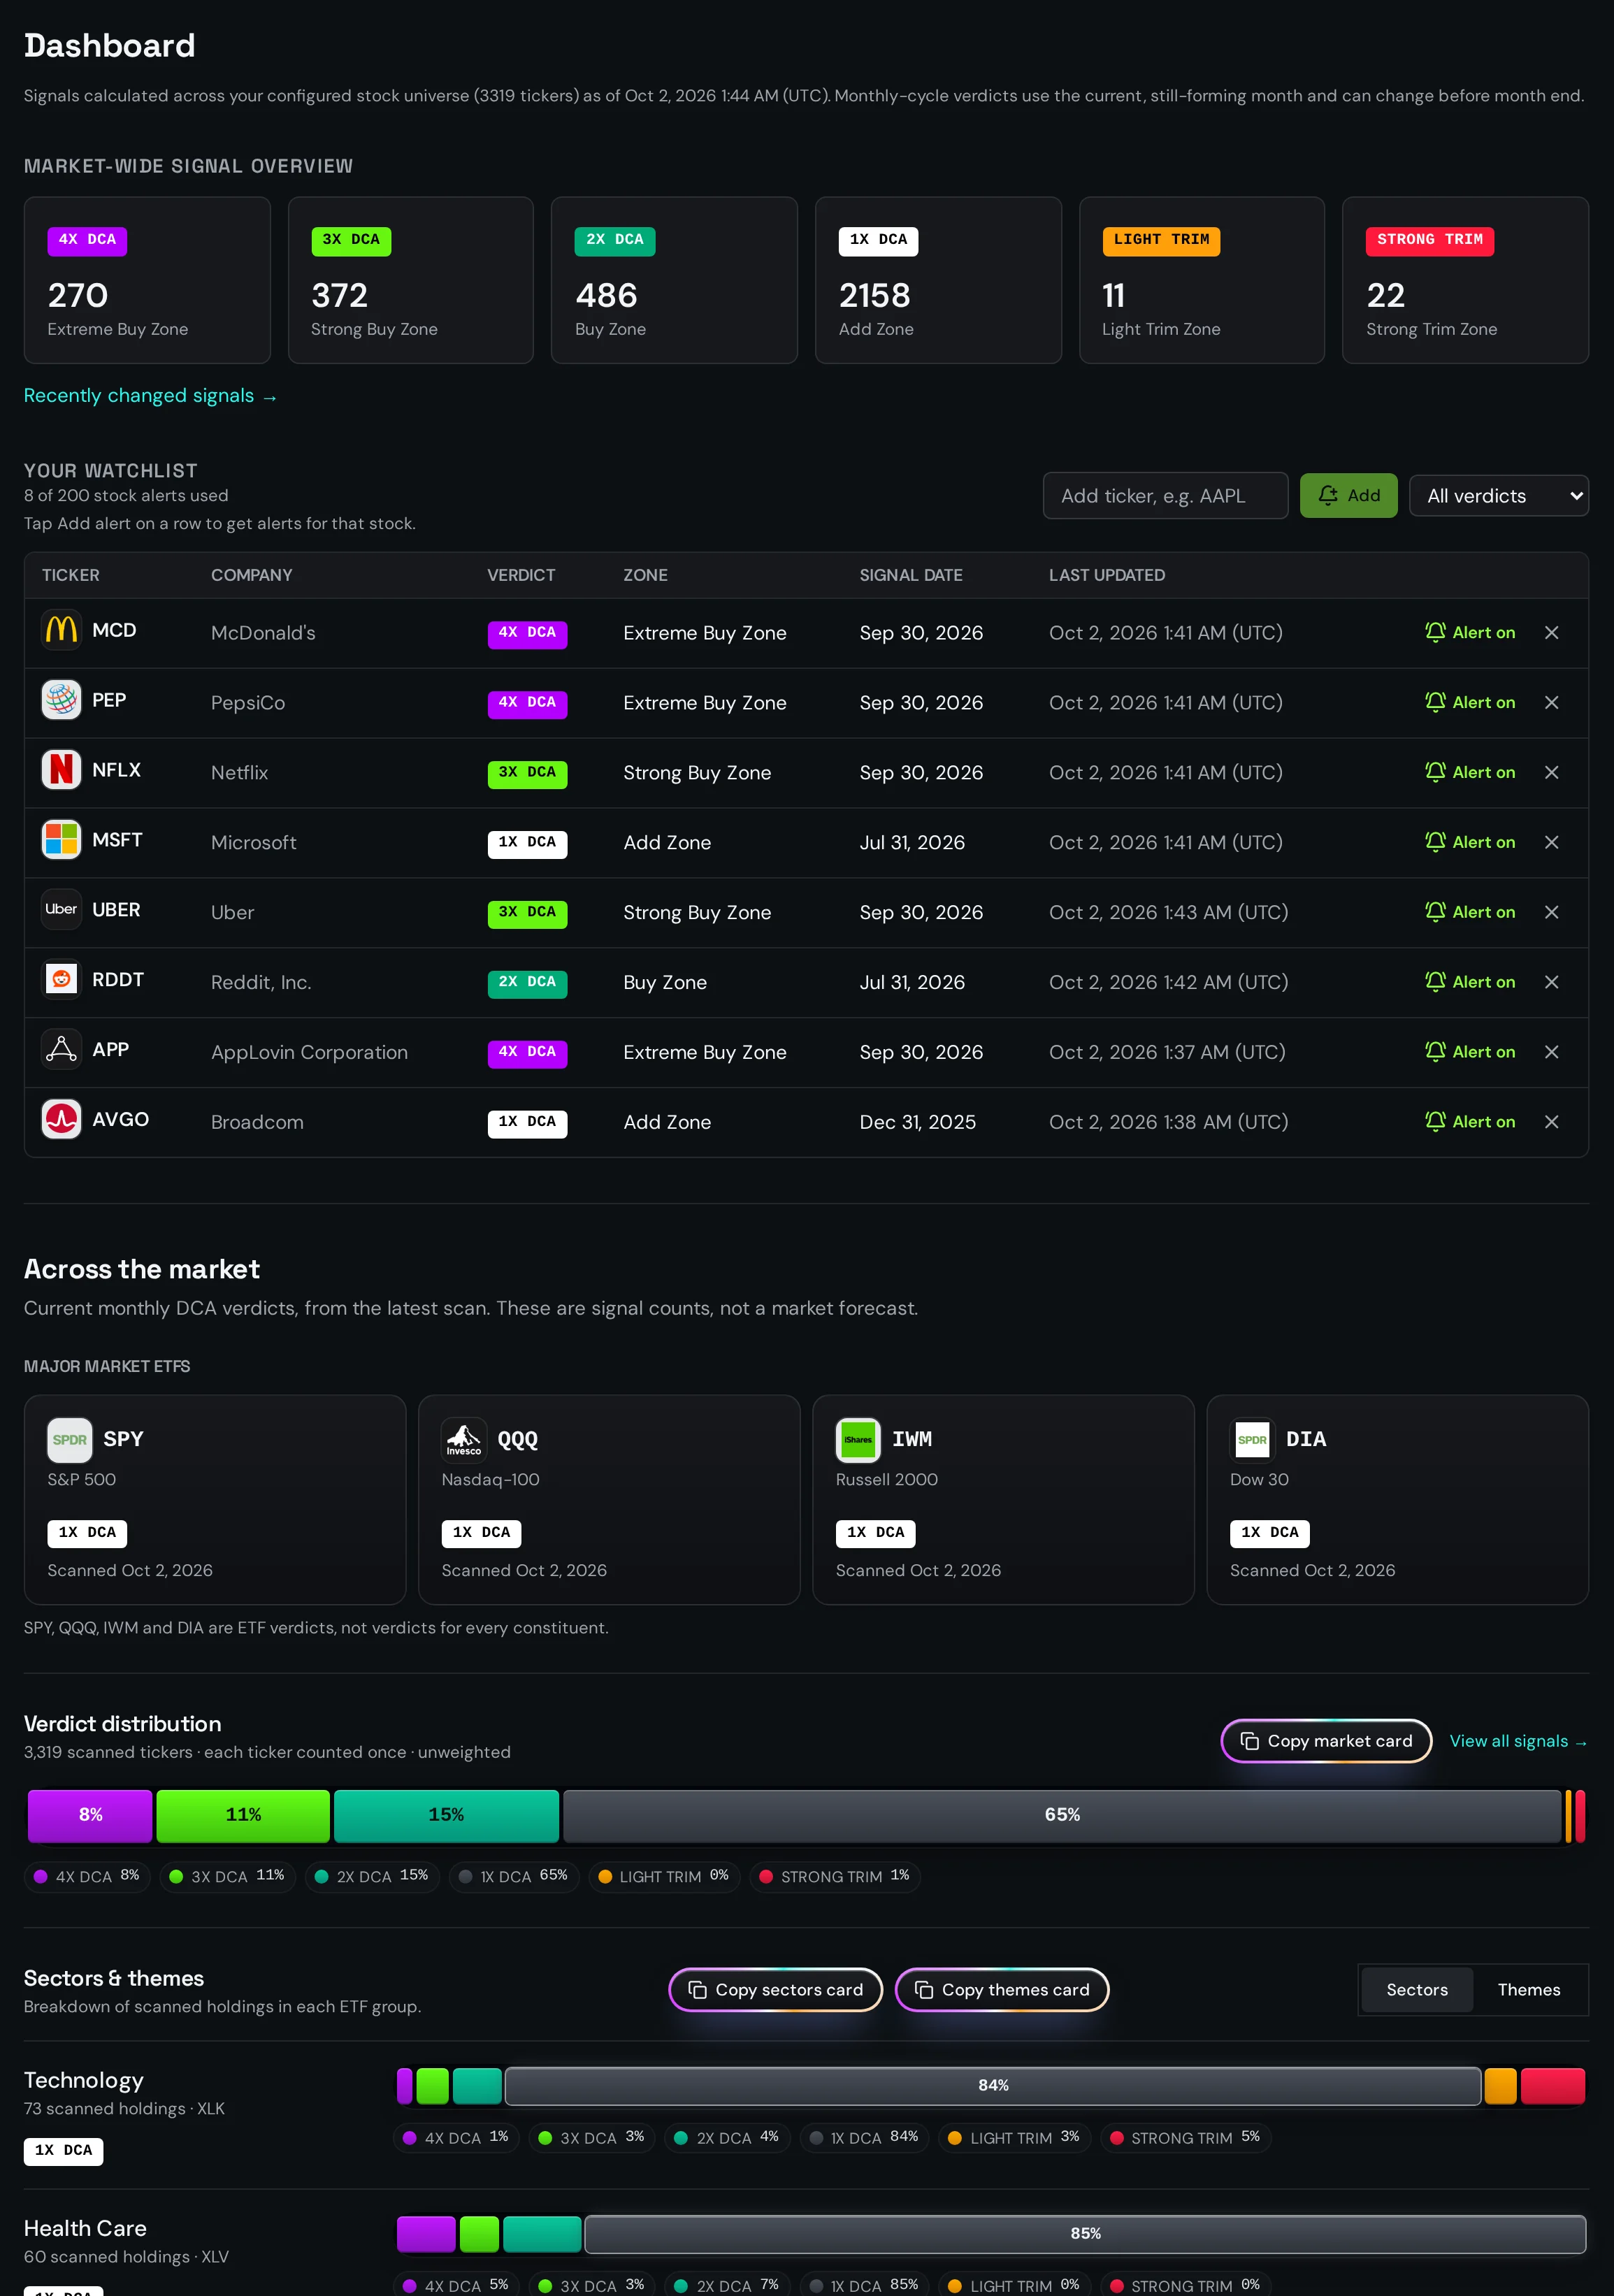
03 / Dashboard & alerts
Your watchlist, at a glance.
Market snapshot, saved tickers, and an email when a verdict you pick shows up.
Read the legend
Six zones. One verdict a month.
Built on a proprietary algorithm. 1X–4X show signal strength, not dollar amounts or trade sizes. Trim is a signal label, not a sell order. You decide what to do.
DCA Optimizer™
Verdict: 1X DCA
Legend
- 4X DCA = Extreme Buy Zone
- 3X DCA = Strong Buy Zone
- 2X DCA = Buy Zone
- 1X DCA = Add Zone
- TRIM = Light Trim Zone
- TRIM = Strong Trim Zone
Backtests
DCA Optimizer vs Your Buys.
Same total money, different timing. See how buying at signal levels compared with buying the same amount every month — on every ticker.
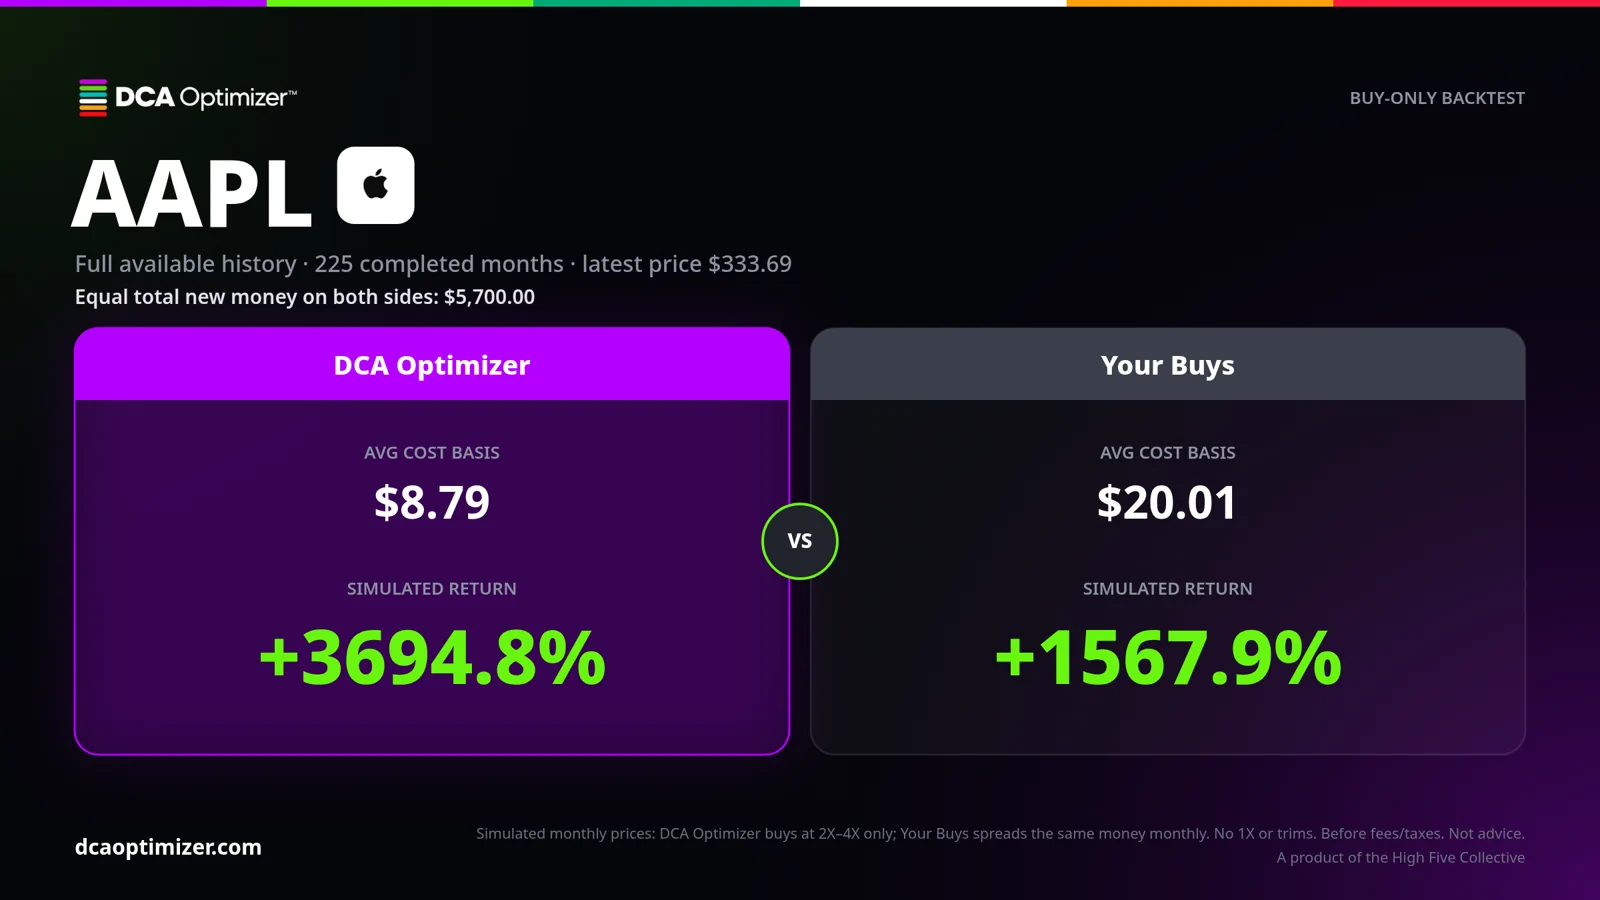
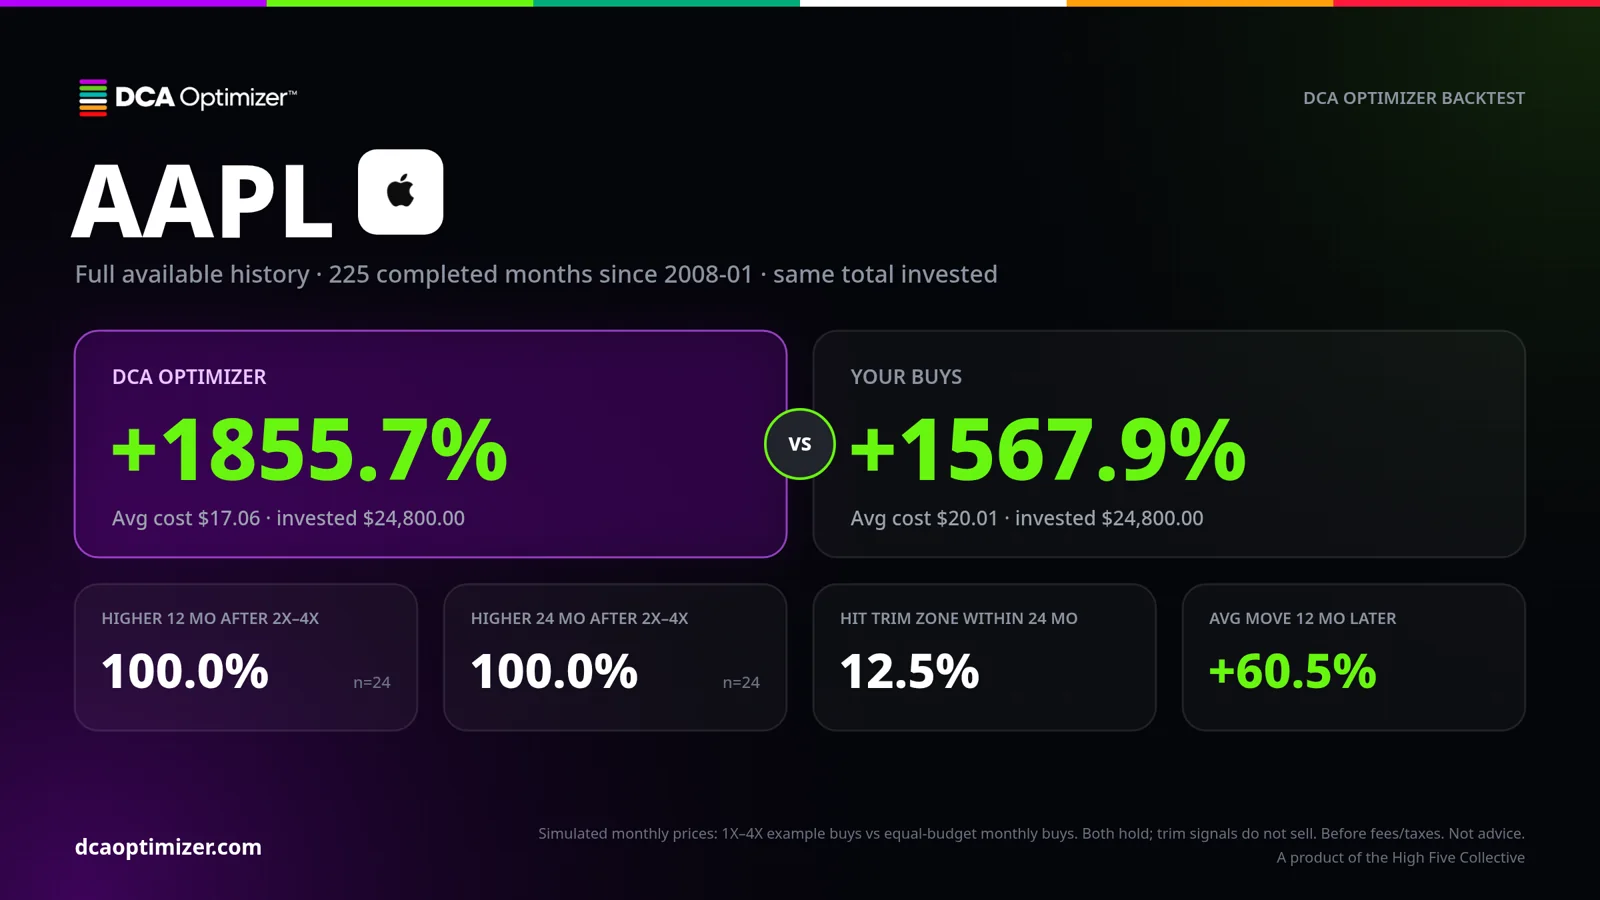
Actual app-generated AAPL cards captured Oct 3, 2026. Hypothetical: trim signals are shown but never sold, and either side can come out ahead. Excludes fees, taxes and slippage.
Backtest results · updated live
How often does it win?
Across every stock we've backtested, how often the full 1X–4X simulation ended with more money than buying the same amount every month.
- …
- —
- …
- —
- …
- —
- …
- —
- …
- —
- …
- —
Based on the stocks backtested so far — the rest catch up as the daily scan re-runs. Hypothetical simulations from historical monthly prices: no fees, taxes or slippage, trim signals are shown but never sold, and either side can come out ahead. Past results don't predict future returns.
Built to share
Take the chart with you.
Download or copy branded chart images, backtest cards and X cards straight from the app, or share a frozen snapshot link.
Membership
Pick your plan.
Start with Standard free for 7 days, or go Pro for more history, more alerts, more charts and more data.
Standard
7-day trial$20/ month
or $200/year · trial for new accounts
- DCA Optimizer
- All signal lists and verdicts
- 18 months of charts and backtests
- 3 ticker alerts
Pro
Full access$30/ month
or $300/year · no trial
- Everything in Standard
- Full chart history
- All backtest periods
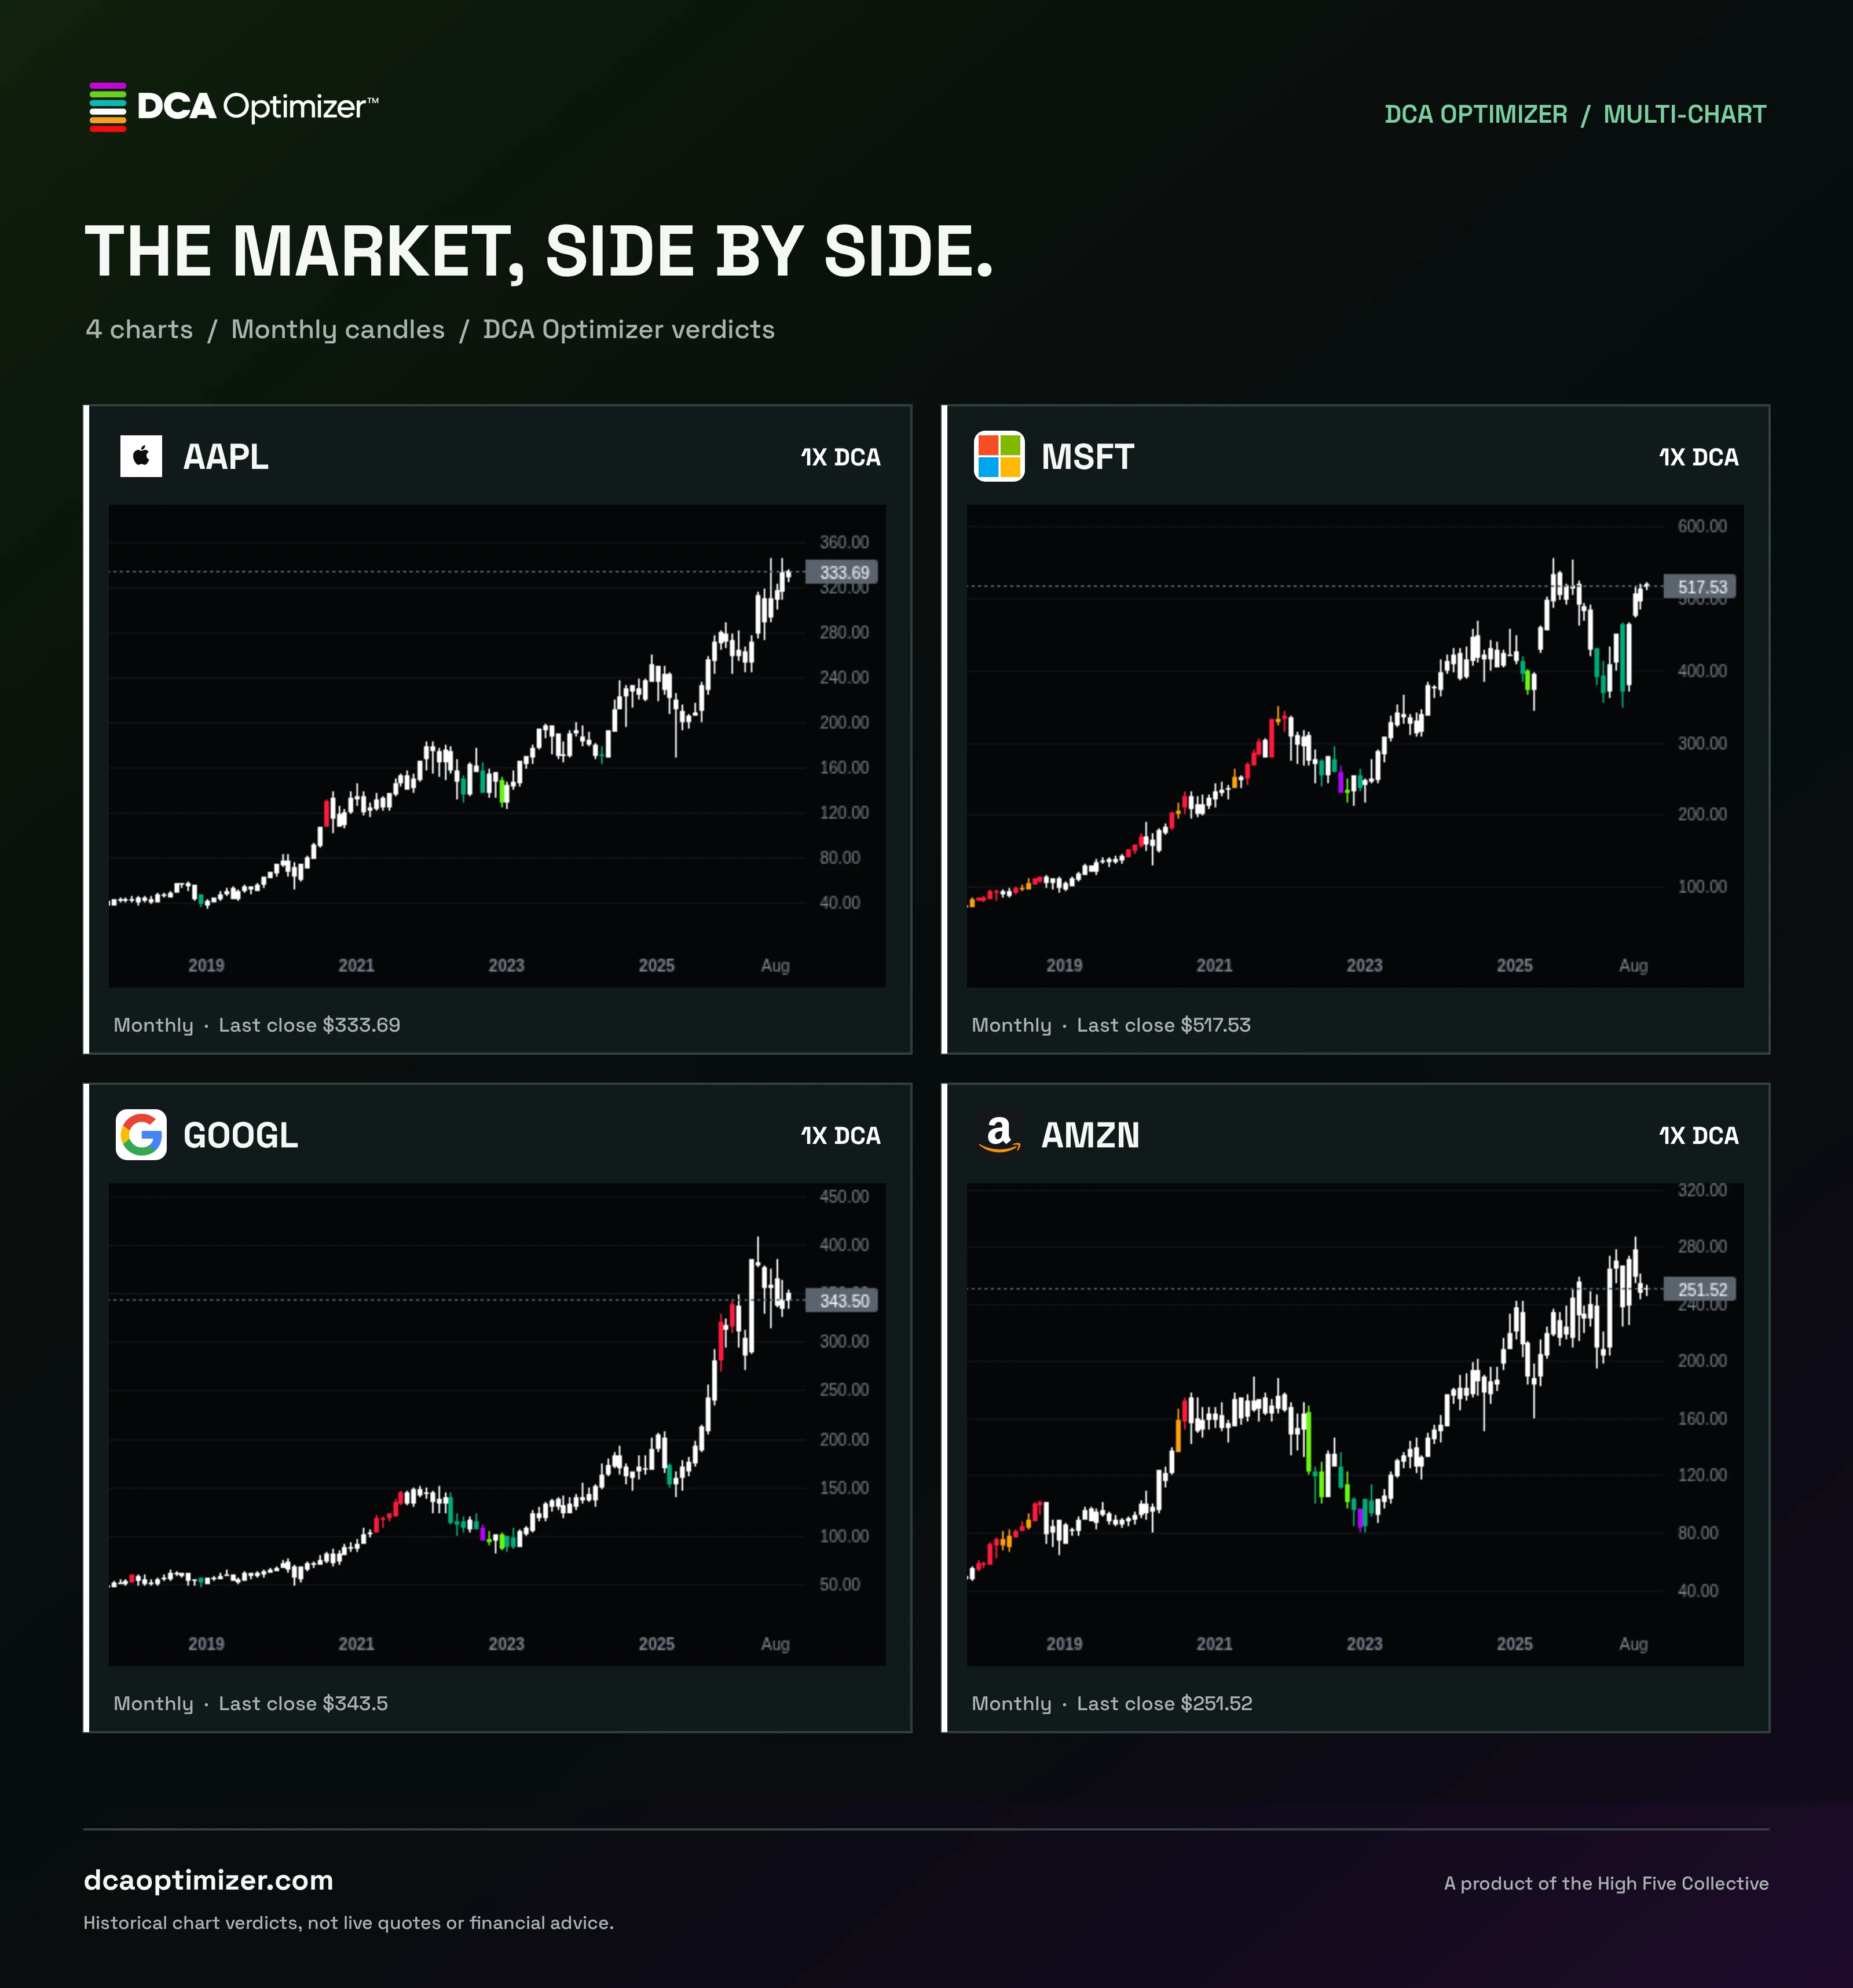
- Multi-Chart
- 200 ticker alerts
Chart history
Standard · Last 18 months
Pro · Full history
Backtest periods
Standard · Last 18 months
Pro · 1, 3, 5, 10, 20 years or full
Ticker alerts
Standard · 3 tickers
Pro · Up to 200 tickers
Multi-Chart
Standard · Not included
Pro · Up to 6 charts at once
- 01Choose a plan
- 02Create your account
- 03Check out here and open the app
Cancel future renewals from your Account page. All sales are final after billing begins. A product of the High Five Collective.
The details
Good questions.
What is the DCA Optimizer?
A web app built around a proprietary algorithm. It shows the indicator’s zone and verdict on charts, alongside signal lists, history, alerts and simulated backtests. Its internal rules and math stay private.
What do 1X, 2X, 3X and 4X mean?
They are signal intensity levels from the indicator’s own legend, not dollar amounts or instructions for how much to invest. You set your own position size.
Does it pick stocks or place trades?
No. You research what to follow and make your own decisions. The app does not assess fundamentals, manage money, or execute trades.
Are these real returns?
No. Backtests use historical monthly prices and example buys to compare two hypothetical approaches using the same total money. Trim signals are visible, but the simulation does not sell shares. Either approach can come out ahead. Results are not predictions.
What is the difference between Standard and Pro?
Standard includes signal lists, charts and backtests covering the last 18 months, and alerts for 3 tickers. Pro adds full chart history, every backtest period, Multi-Chart and alerts for up to 200 tickers.
Is there a free trial?
New accounts can start Standard with a 7-day free trial. Pro has no trial. Standard costs $20/month or $200/year afterward; Pro costs $30/month or $300/year. All sales are final after billing begins.
Can I share a chart?
Yes. Download or copy chart, comparison and stats images. Multi-Chart can export a single composite image on Pro. Public chart links show a frozen snapshot, not a live verdict.
How often do signals update?
The official monthly scan runs on weekdays after the market closes; the current month is still forming and a verdict can change. Prices shown in lists are scanned closing prices, not live quotes.
Do I need TradingView?
No. Charts, signal lists, backtests and alerts are all inside this web app.
How do I get access and cancel?
Choose a plan, create an account, and check out on this site. Active memberships unlock the app. Cancel renewals from your Account page; you can sign back in with the same login to restart later.
Your next move
Optimize your cost basis today.
Try Standard free for 7 days. You decide what to follow.
Images show frozen examples, not current signals or recommendations. Historical backtests are hypothetical, not actual trades or guaranteed returns. They exclude fees, taxes and slippage. Past price action does not predict future results.
Also from the High Five Collective
Investing Collective
Invest With Clarity. Build Wealth With Conviction.
Access to high conviction stock research, portfolio buys, adds, trims and sells, DCA Optimizer verdicts, Smart Money zones, valuation, long term targets, investing education, and community access.
A separate Whop membership. DCA Optimizer access is not included.
$69/ month
Billed through Whop. All sales final.
Explore Investing CollectiveWhop adds a $3.45 service fee at checkout, so your first charge is $72.45. It is not part of the $69 plan price.